
A Toy Model and Its Implications

“By allowing free market capitalism to continue unchecked, the trend of increasing inequality will only continue.”
Historically, various controversial tax systems have been imposed to reduce inequality, from the Roman effort in the third century B.C. to limit the personal wealth of individuals, to David Lloyd’s George’s ‘People’s Budget’, announced as a “war budget” in the battle against poverty in 1909. This term has been distorted by the current coalition’s ‘People’s Budget’, which seems to have had the opposite aim.
Nigel Forman, in his book Single Rate Tax, argued that seven principles are key to validate reforming a taxation system: simplicity, neutrality (“the minimum distortion to economic behaviour”), encouragement of economic vitality (speculative investment and risk taking), efficiency (cost-effective financing of unavoidable public expenditure), relative fairness, transparency and sufficiency. Whether this is necessarily a good starting point is doubtful; for instance, the principle of neutrality is clearly counter-productive to the redistributive power of taxation. By allowing free market capitalism to continue unchecked, the trend of increasing inequality will only continue.
As forced reallocation of wealth has proven to be a rather brutal method of enforcing equality, a less radical tax system which works towards equality is likely to be more successful. As our society largely comprises of autonomous organisations, a recommended tax system for these corporations should be able to quantify its social contribution, partly by the pay equality of its employees.
Some of the most applicable theory to help quantify corporate responsibility and employee pay inequality was ironically created by a fascist, the Italian mathematician Corrado Gini. In 1912, Gini developed what is now known as the ‘Gini coefficient’, which gives a normalised measure of how a resource is spread-out within a population. Applying this to the GDP of a country, 0 would indicate perfect communism (i.e. the income would be spread out equally between citizens) and 1 would imply a single citizen owning the entire yearly product of the country in question.
Economists often use this measure to compare progress between countries. For instance, from the 1960s to the early 2000s, the UK has gone from a value of around 0.25 to above 0.35 and is rising still. Contrast this to Norway over the same time period, where we see a value fall from just below 0.4 to around 0.25. This quite clearly corresponds with the public policy of the time; during the Thatcher period we see the greatest rise of inequality in Britain. Whilst these value changes seem minimal, if one considers the population size that this represents then one can imagine that the underlying effect must have been highly significant.
One might suggest that if we disregarded a company’s impact on its external surroundings (community outreach, corporate responsibility, environmentalism) then a good measure of the ‘morality’ of a firm would be how evenly spread its pay was.
Suppose we have 2 firms with vastly different management structures:
– Company A has a progressive management structure where each promotion leads to an incrementally higher salary.
– Company B has a lone manager earning a sizeable salary whilst the other employees are paid comparatively little.
To illustrate this, consider a small business with 30 employees and a manager (31 employees altogether); the owner has set aside £600,000 for pay. Consider the pay being distributed in two ways: either progressively with more experienced employees being paid more (Company A), or where the manager takes the lion’s share, and all other employees are paid minimum wage. An example pay structure is given below:
|
Pay level |
Company A: number of employees at said pay level | Company B: number of employees at said pay level |
| £13,000 (approx. minimum wage.) | 16 | 30 |
| £18,000 | 8 | 0 |
| £25,000 | 4 | 0 |
| £34,000 | 2 | 0 |
| £80,000 | 1 | 0 |
| £210,000 | 0 | 1 |
| Total wage bill: | £600,000 | £600,000 |
| Gini coefficient: | 0.24 |
0.32 |
As we see from the table above, the Gini coefficient for company A is 0.24 (or 24 per cent) and 0.32 (32 per cent) for company B.
Suppose there is a taxation system where the rate of tax reflects a company’s Gini coefficient. In the case where there is a direct correspondence between the two for the above example, company B would be taxed an additional 31 per cent over company A. This could then be used as an incentive for companies to enforce progressive pay structures and promote equality. Indeed, under scheme B, the owner might then decide to channel some of the profits of the firm into workers’ pay in order to receive a tax break.
Comments on the Gini measure
There are two key points to note when considering the benefits and flaws of this system. Firstly and somewhat intuitively:
Theorem: As the size of the population becomes larger than the size of the companies in that country, the Gini coefficient of the country as a whole will be less than that of its constituent companies.
Outline of proof: Asymptotically true as the size of the population becomes larger than the size of an average company.
The above theorem basically says that the population as a whole will be more equal than that of a typical company. This implies that if companies are encouraged to spread out their wealth, then the country as a whole will become more mathematically ‘equal’.
There is a relatively major flaw to using this measure as a taxation system, but it is partially self-correcting. The problem relates to changing the size of the employee pay pool; potentially one could reduce the size of the total employee pay package and reduce their taxation simultaneously by carrying out a clever redistribution. To demonstrate this, I refer back to the previous example; consider Company A – the owner has decided to redistribute pay accordingly:
| Pay level | Company A: number of employees at said pay level(Before) | Company A: number of employees at said pay level(After) |
| £13,000 (approx. minimum wage.) | 16 | 16 |
| £15,000 | 0 | 8 |
| £18,000 | 8 | 0 |
| £20,000 | 0 | 4 |
| £25,000 | 4 | 0 |
| £30,000 | 0 | 2 |
| £34,000 | 2 | 0 |
| £80,000 | 1 | 1 |
| Total wage bill: | £600,000 | £548,000 |
| Gini coefficient: | 0.24 | 0.22 |
In the above table, the salaries of all mid-level staff have been reduced, saving the owner £52,000, while the Gini coefficient has fallen marginally, potentially reducing the tax bill. Whilst this example is not particularly encouraging, it seems like a relatively unlikely scenario as it would be difficult for an employer to arbitrarily reduce the pay of a large number of employees. It should also be noted that as the size of the firm grows larger, the incremental changes to this measure would be small unless huge company-wide changes were made. Equally, as well as reducing the employee pay pool, increasing the pay pool too would be difficult. The best option therefore for most employers would be to redistribute the pay of a company whilst keeping the total pay bill constant.
Extensions
The above measure is a starting point for tackling intra-company inequality, but the suggestion is by no means perfect. Below are two reasonable alterations.
It may well be the case that many firms may have startlingly similar Gini coefficients, even though their structures are quite different. One can exacerbate the effect of the measure by rescaling, so for instance, consider the formula:
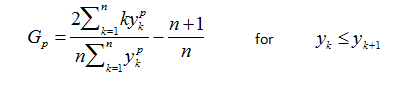
The typical Gini coefficient is for p=1 where yk is the salary of kth lowest paid employee. When p>1, the effects of a small decrease in equality will be artificially increased.
Finally, it should be noted that a firm’s tax bill should in addition reflect its external effect on the world around it. For instance, one would bet that an oil firm or a bank would actually have quite a low Gini coefficient as everyone is well paid, meaning that, by the previous measure, these firms could almost be considered progressive. Therefore, there would have to be a second component to the tax bill reflecting these other factors, which would have to be calculated separately by sector using more ad-hoc methods.
Further Considerations
At the heart of a new taxation system would have to be a unified approach to dealing with both corporation tax and income tax, a line that has become increasingly blurred as various notable individuals are now registered themselves as companies. Conversely, in the US, a company can have the same rights as an individual in the eyes of the law. Whatever system is chosen, a full study needs to be carried out to assess practicalities and close potential loopholes. There is also the question of how one deals with income tax from employment; would this even be necessary in a system where income inequality is self-correcting?
The rise of inherited wealth is now undoubtedly the largest remnant of an unhindered form of wealth acquisition. It should be obvious that this needs to change, but with the trend of ‘gifting’ resources to relatives, an inheritance tax has become largely obsolete. By classifying all forms of capital transfer as income, the problem resolves itself.
Regarding tax evasion and the international nature of most large companies, we must also deal with companies being run from afar and the implications of this. A simplistic non-solution would be an ‘operations tax’, where firms are taxed based on where they were conducting business – not relating to the location of their headquarters. However, this idea is somewhat hampered by the emergence of Internet-based firms, where their location of operations – especially for electronic goods and software – is somewhat debatable.
The challenge of reducing inequality is hardly a trivial matter, especially when coupled with other relevant issues such as tax evasion and offshore tax havens. When devising policy, one can imagine splitting the inequality problem quite broadly into two key challenges. First, we need to develop a method to fairly fix the wealth gap that has been growing over the past few generations. Second, we need to develop a sustainable economic model in which everyone can flourish without the inbuilt structural bias we see today. These challenges are best approached simultaneously, and we should start by building a fair but firm taxation method to continuously reduce the unjust legacies of previous systems.
Jake P. Taylor-King is a D.Phil student studying Mathematical Biology, focusing on biological agent movement, swarming behaviour and cancer network modelling. He is also the secretary of the Oxford University Labour Club. Lewis Greaves, who also contributed to the article, reads German, Russian and Czech at St. Hilda’s College, Oxford.
Picture credit: ChristianPost
